Automation and water storage are the obvious future, but until a ski resort can invest millions of dollars, the near-future is about utilizing existing assets. And this is accomplished with business analytics that identify, measure and improve operational performance.
Business Analytics for Snowmaking
Every aspect of business is scrutinized with analytics that identify profit (productivity) margins. Reality is that maximum snow production remains unidentified and unmeasured, thus assets and technology are underutilized. The main reason is because of poor accounting methods. Snowmaking is typically managed from the top-down with allocated funds, averages, totals and habits; instead of bottom-up from operational benchmarks and real-time KPI’s that quantify efficiency.
The result of these methods is that typical snowmaking reports only show where snow production is at; but not where maximum production should be.
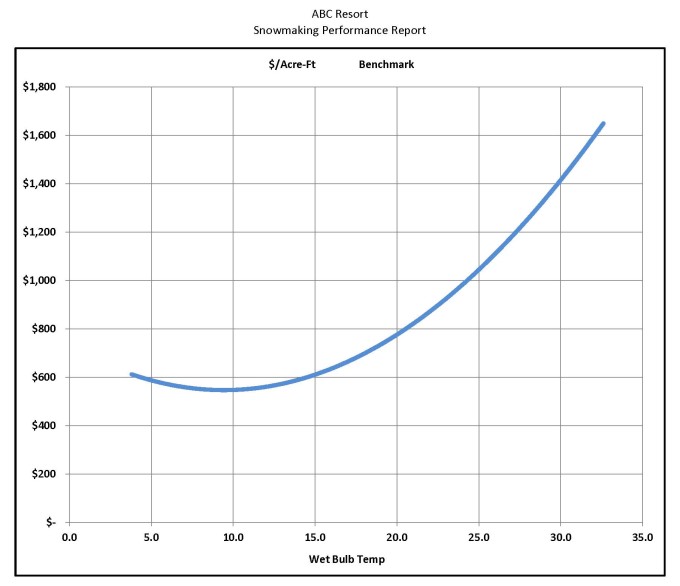
To identify and measure utilization; requires more advanced accounting methods than just averages, totals and one-dimensional-outputs. It involves multi-level data analytics. The first level correlates costs for energy, water and labor, to the variable of temperature. This method creates a benchmark or performance standard for the entire operations – and not just GPM. An example is shown below. The Y axis represents costs for energy, water and labor, while the X axis is temperature. The intersection shows exactly where maximum production should be at for every degree of web bulb temperature. (Note: data for this benchmark is resort-specific and not an industry guideline)
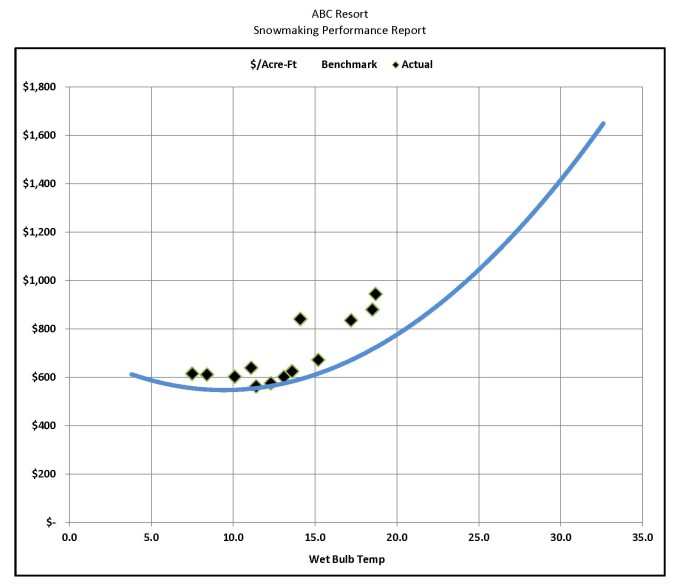
Once the operational benchmark is established, managers plot real-time data against it to identify snowmaking efficiency. A simple chart informs them where utilization is at AND where it should be. Below is an example of plotted data for 12-hours of snowmaking. Data marks above the line indicate poor performance, while marks below the line indicate good performance.
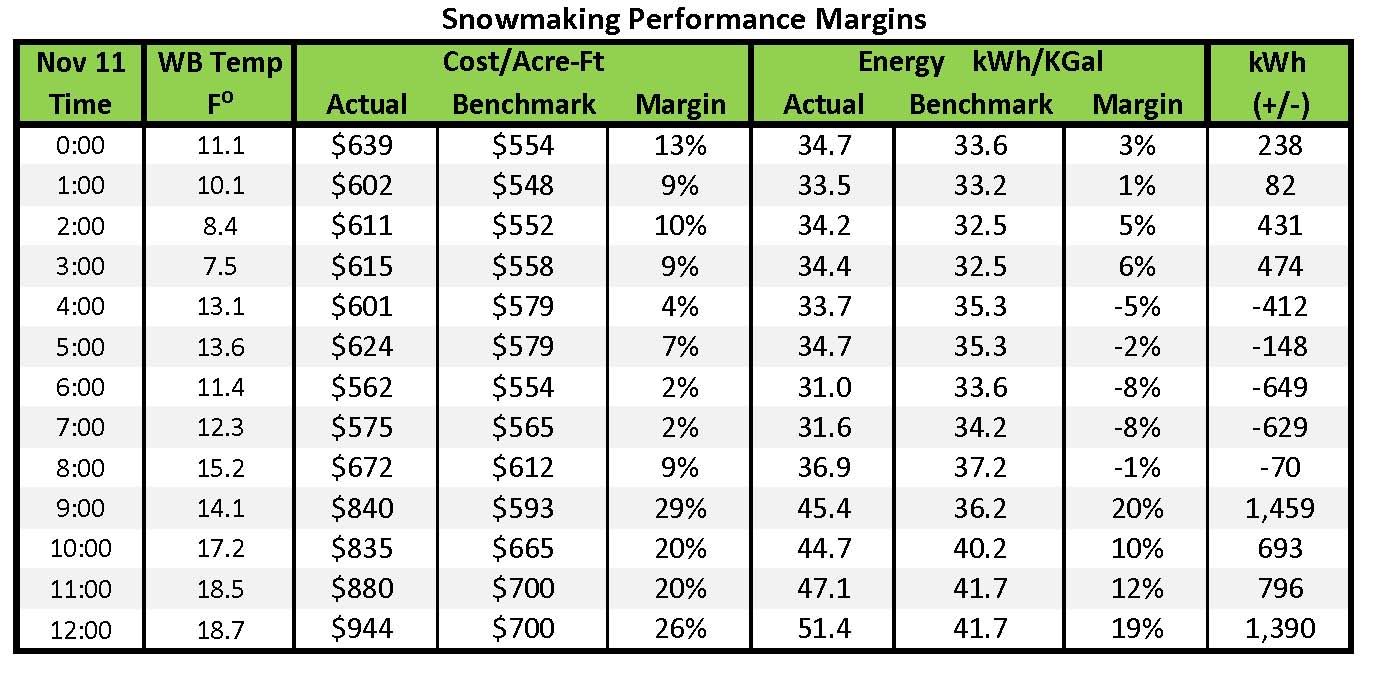
The next step of the process is to quantify the difference in performance. Just like profit margins in financial accounting, these gaps are measured with margins. Thus, managers not only know where production is at, they also know where it should be, as well as the significance of the difference. The text-based data for 12-hours of snowmaking is shown below. Note that lower margins are better performance. Data for this entire day of snowmaking is shown by clicking the link to Daily Snowmaking Reports.
 When Managers are empowered with these KPI’s, improved awareness and operational adjustments maximize snow production by optimizing both mechanical and human assets. Beyond annual energy savings of 4%-20%, asset utilization increases snow production by making more snow sooner. Every manager wants more snow because higher trail counts and deeper base depths generate more revenue.
Why Analytics Make Business Sense?
Ski resorts invest millions of dollars in snowmaking equipment. Without a system of accountability, there is no way to know if investments are being utilized. Simply stated, we can’t manage what we don’t measure.
The Future is Now
In summary, the near-future of snowmaking belongs to asset utilization. Bottom-up accounting tools are available to correctly measure performance and make better informed decisions. The result is more snow for less expense, which goes directly to the bottom line of business.
Noteworthy
This same process of operational analytics (Benchmark, Target, Reduce, Report) is endorsed by the
U.S. Dept of Energy, ISO 50001, Superior Energy Performance™, NSAA Climate Challenge, and Lean Six Sigma.
Great information. I need metrics that accurately measure our snowmaking. I’ll give you a call.